Is the CME Term SOFR Rate an Unbiased Predictor?
A term or forward value of an interest rate in the ideal world is a perfect predictor of the future value of the rate. For all practical purposes, we focus on differences between the term value and the realized value. For example, the value of a 30 day forward rate observed today can be compared with the actual value 30 days in the future.
Historical data can then be used to compute a distribution of differences over a long period of time, such as 6 months or a year. If the distribution of differences has a mean near zero (say 1 to 2 BPs), it is likely to be unbiased. The variance in the bias should be small as well.
We tested the CME 90 and 180 day SOFR term rates, available since 1/3/2019. Also, we obtained SOFR 90 day and 180 day rates compounded in arrears for the same dates. The 30 day rates were excluded from the initial analysis, as they use arithmetic averaging instead of compounding. The differences we tested were therefore
<CME 90 day SOFR term rate on Day D> - <SOFR 90 day CIA rate on Day D+90>
And
<CME 180 day SOFR term rate on Day D> - <SOFR 180 day CIA rate on Day D+180>
The ending dates when the analysis was performed on 5/14/2021 were 10/1/2020 for the 90 day calculations and 2/27/2020 for 180. That is, the sample sizes were 439 dates and 288 dates.
BIAS PRESENT IN TERM RATES
Thbiaschecke analysis shows that bias is evident in the term rates, in the sense that they overestimate future values. The 90 day term rate is on average 58 BPs higher than the realized value, with almost the same standard deviation. Another measure of the bias is the percentage of days when the difference is negative, meaning the term rates underpredict the realized value. For the 90 day sample, this happened only 15% of the time.
The 180 day term rate is worse. The average overestimation is 160 BPs, with a standard deviation of 27. And none of the dates has an underprediction.
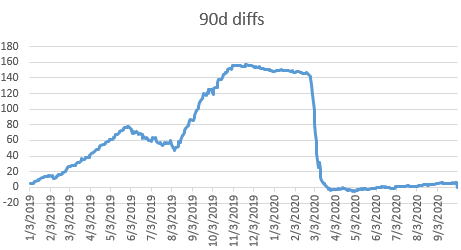
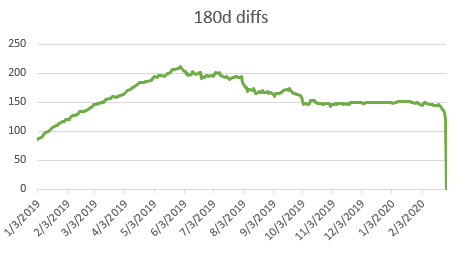
TIME HISTORY OF BIAS
The 90d differences (see figure) have been near zero for about 6 weeks, though there have been some periods where it was way off. On the other hand, the 180d diffs have almost always been higher than 100 BPs.
``
The analysis was performed in Excel. The file can be downloaded here: https://delta-vega.com/wp-content/uploads/2021/05/biascheck.xlsx